Output Object Details in a Grid
Script Purpose
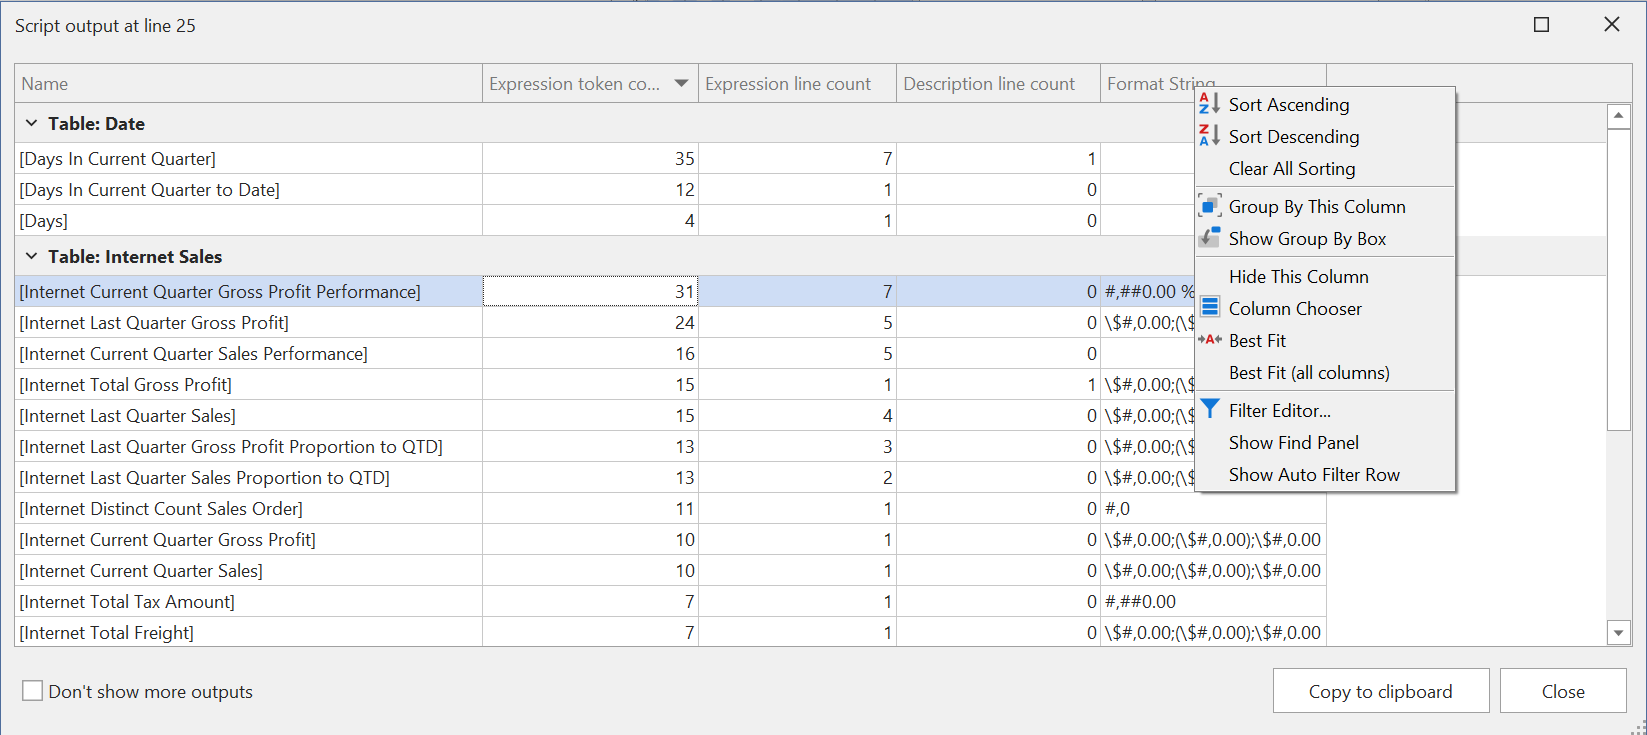
Another way to get an overview of objects in the model, and how they are configured, is to output them in a grid using the C# DataTable class. This is a very flexible technique, as you can add only the information you are interested in, as columns of the DataTable. Moreover, when passing a DataTable to the Output() method, Tabular Editor will automatically display it in a grid view, which is very convenient for inspecting the data.
Script
Show measure complexity details
// This script displays a grid with details about each measure in the model.
using System.Data;

var result = new DataTable();
result.Columns.Add("Name");
result.Columns.Add("Table");
result.Columns.Add("Expression token count", typeof(int));
result.Columns.Add("Expression line count", typeof(int));
result.Columns.Add("Description line count", typeof(int));
result.Columns.Add("Format String");

foreach(var m in Model.AllMeasures)
{
    var row = new object[]
    {
        m.DaxObjectName,    // Name
        m.Table.Name,       // Table
        m.Tokenize().Count, // Token count
        m.Expression.Split(new []{'\n'}, StringSplitOptions.RemoveEmptyEntries).Length,
        m.Description.Split(new []{'\n'}, StringSplitOptions.RemoveEmptyEntries).Length,
        m.FormatStringExpression ?? m.FormatString
    };
    result.Rows.Add(row);
}

Output(result);
Explanation
This snippet first configures a DataTable object with the columns we want to display in the grid. We explicitly specify the typeof(int) for some of the columns, to ensure that sorting works correctly. We then iterate over all measures in the model, and for each measure, we create a new row in the DataTable with the desired information. Finally, we pass the DataTable to the Output() method, which will display the grid.
The columns displayed are:
- Name: The name of the measure.
- Table: The name of the table the measure belongs to.
- Expression token count: The number of tokens in the measure expression. This is a rough measure of DAX complexity.
- Expression line count: The number of lines in the measure expression, not counting empty lines.
- Description line count: The number of lines in the measure description, not counting empty lines.
- Format String: The measure's format string expresssion or format string, if any.
Example Output
