Table Preview
A Table Preview shows the contents of one table, row by row, without writing a query. Right-click a table in the TOM Explorer view and choose Preview data, or select the table and press Ctrl+R.
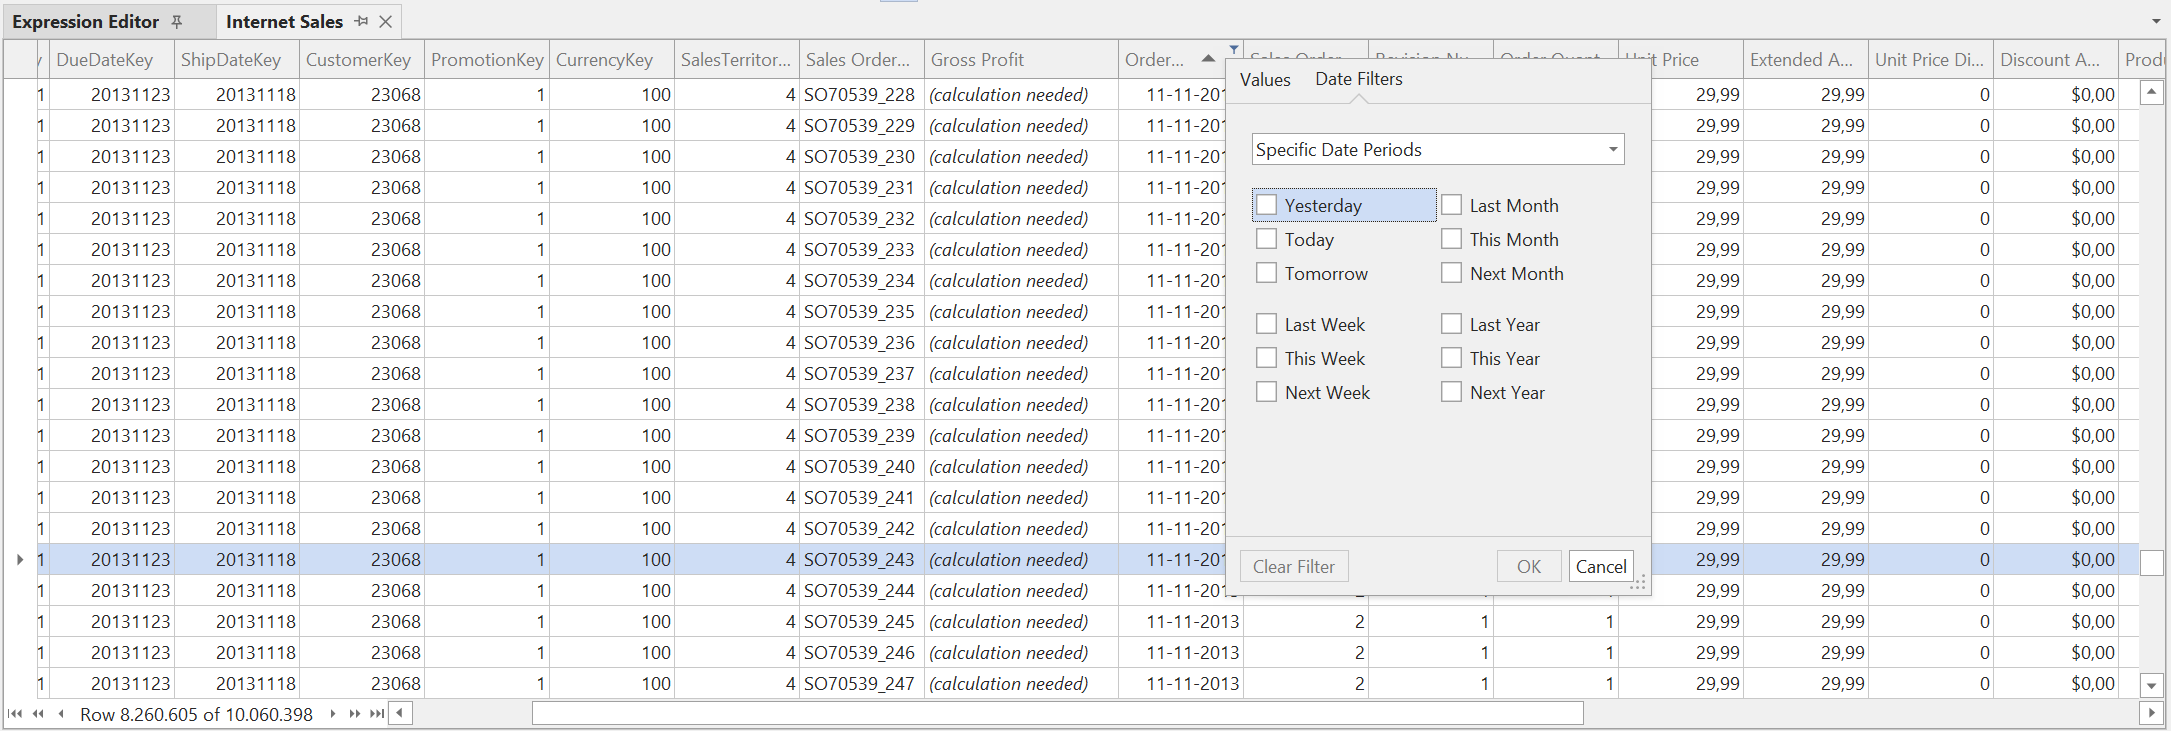
You can open a preview of several tables at once and arrange them however you like. Each preview is an ordinary document, so it can be docked, floated or moved to a second monitor.
Reading the grid
Tabular Editor executes a DAX query that returns only as many rows as the view can show, then pages in more as you scroll. How far you can scroll depends on the storage mode and the engine:
| Table | Scrolling |
|---|---|
Import, on an engine that supports WINDOW, where the table has a primary key |
The full table. Paging uses WINDOW against the primary key |
Import, without WINDOW support or without a primary key |
The first rows only; the preview says that scrolling is disabled |
| DirectQuery | The first rows only, up to the Row limit preference; an informational message explains why |
Preview metadata is cached for the session, so reopening a preview does not re-query the server. Use Refresh Preview to re-read it if for example the model has been processed outside Tabular Editor.
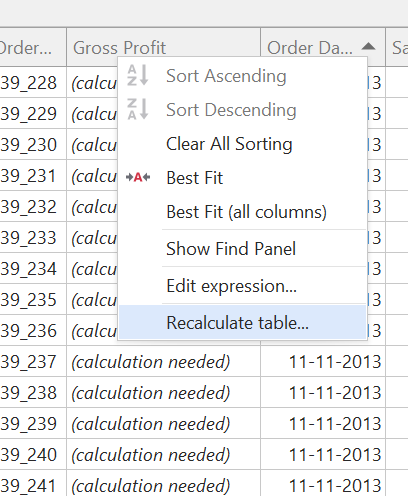
If a calculated column is in an invalid state, its cells read (Calculation needed). Use Calculate Table on the toolbar, or Recalculate table... on the column's right-click menu, to bring it up to date.
Column order
By default, columns appear in the order the engine returns them, which is roughly internal column order and often looks arbitrary. Tick Sort table preview columns alphabetically under Controlling preferences to have them follow the same order the TOM Explorer uses instead.
Finding a column in a wide table
Selecting a column in the TOM Explorer view scrolls the preview to that column and highlights it. This is on by default and can be turned off for a single preview with Track selected column on the toolbar, or for every preview under Controlling preferences.
Toolbar
The Table Preview toolbar and the matching Table Preview menu carry the same commands:
| Command | What it does |
|---|---|
| Impersonation... | Choose the identity the preview query runs as, to see the data a particular user would see |
| Refresh Preview | Re-read the table, discarding cached metadata |
| Auto-refresh | Refresh this preview automatically whenever changes are made to the deployed model. The default for new previews comes from Controlling preferences |
| Track selected column | Follow the TOM Explorer's column selection, as described above |
| Calculate Table | Recalculate the table's calculated columns |
Right-click menu
On top of the standard grid commands (sorting, filtering, best fit, column chooser), the preview grid adds:
| Command | Where it appears | What it does |
|---|---|---|
| Lock column widths | Column header | Stops the grid resizing columns as you scroll and page in more rows |
| Edit expression... | Header of a calculated column | Opens that column's DAX expression in the Expression Editor |
| Recalculate table... | Header of a calculated column that is not up to date | Recalculates the table |
| Show actual DAX query... | Anywhere in the grid | Opens a new, editable DAX query document containing the query behind the preview |
Show actual DAX query
Show actual DAX query... takes the query the preview is running, including whatever filter and sort you have applied in the grid, formats it and opens it as a new DAX Query document. It is not executed for you; edit it and run it when you are ready.
The paging wrappers are deliberately left out, so what you get is the query over the data you are looking at rather than the query over one screenful of it.
Note
The DAX Query view has a command of the same name on its results grid, but it does something different: it shows the last executed query in a read-only window rather than opening a new document.
Filtering
Each column header carries a filter dropdown listing the column's distinct values. On a column with many distinct values the list is capped by Max. values in filter dropdown under Controlling preferences, 5,000 by default. Values beyond the cap are not listed and cannot be ticked directly. Raise the cap if you need them, bearing in mind that opening the dropdown then runs a heavier query.
Preferences
Every setting mentioned on this page lives under Tools > Preferences > Data Browsing > Table Preview. See Controlling preferences for the full list.